Analyst's Projection
Launching Channel and bullish strength
Egrag Crypto, a name not unfamiliar in the realm of digital currencies, has recently turned his analytical gaze towards XRP, the beloved rollercoaster of the crypto world. According to Egrag’s charts, XRP is strutting about in what he affectionately calls a “Launching Channel.” Imagine XRP wearing a superhero cape, ready to catapult itself to a whopping $6.4, a significant leap from its current couch-potato price.
The “Launching Channel” is identified by candles that are just flirting with the price levels (partial wicking candles) and a gradual upward consolidation – a classic sign of bullish strength. It’s like watching a seasoned athlete meticulously warming up for a career-defining sprint. Egrag assures that as long as XRP stays within this channel on a weekly timeframe, the market could be readying itself for an "Ignition stage," which could skyrocket XRP's valuation.
However, let's not pop the champagne just yet. Egrag warns, eyebrow raised and all, that a dip below this channel might spell trouble, indicating a reversal of fortunes and potentially halting this anticipated climb. To add context, Egrag’s map also includes crucial price points which are marked by the ever-mysterious Fibonacci retracement levels. Think of these levels as stepping stones or rather, booby traps – with the major ones at $0.45193, $0.59865, $0.75138, $0.94306, $1.30324, and the fanciful 1.272 extension at $3.32217.
Historically, the $1.96778 price mark has been a tough cookie to crack and stands like a bouncer denying entry to the club. These Fibonacci levels are indispensable for traders, offering a potential roadmap and predicting zones where buy-sell tug-of-war might intensify.
Key indicators of accumulation
As we glance at the crypto scoreboard, XRP is trading at a humble $0.5057, experiencing a minor quirk of 0.11% in the last 24 hours. Over the past week, XRP seems to have taken a slight knock, showing a 5.82% decline in value. Despite these bumps, XRP holds a formidable market capitalization of $27.95 billion, which is nothing to sneeze at.
Delving into the technical rabbit hole, the Accumulation/Distribution (Accum/Dist) line and Bollinger Bands have made their grand entrance to provide insights into XRP's current market behavior. The Accum/Dist line, which stands proud at 59.011 billion, is like a seesaw showing where the big bucks are flowing. It's currently on the rise, hinting that more traders are choosing to join Team XRP. This positive trend could propel the value upwards if Uncle Murphy doesn’t intervene with his law.
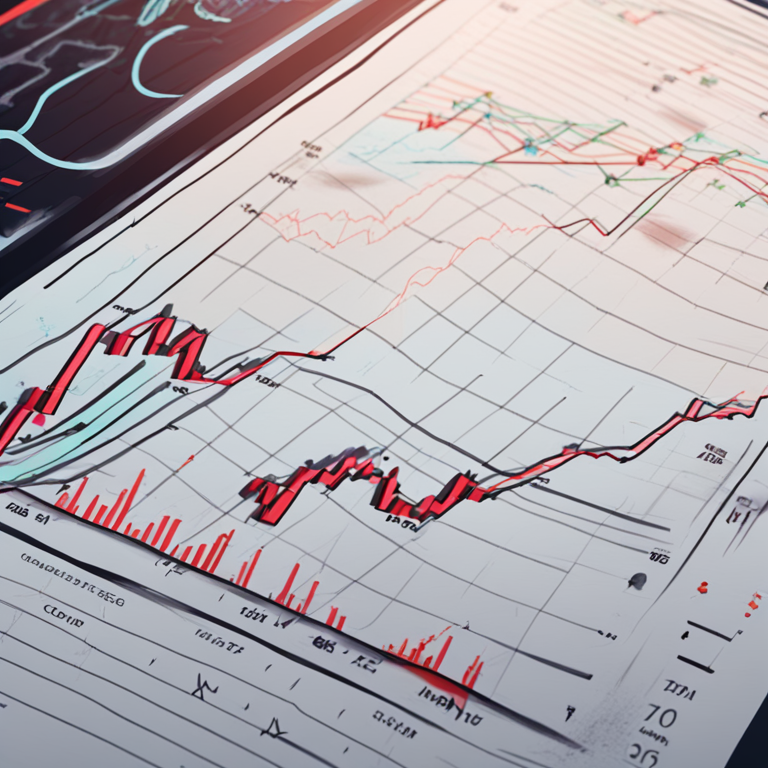
Meanwhile, the Bollinger Bands point towards XRP being an underdog trading slightly below the middle band. For the seasoned trader and the casual observer alike, this indicates it could be undervalued – a potential green light for snazzy investors eyeing a buying opportunity.
Adding more logs to this burning speculation, another crypto enthusiast and market savant, Donovan Jolley, offers his two cents. He believes that the historical zen and technical signs are aligning just right, hinting at an uptrend for XRP. Drawing on the analogy of a "SuperCycle," reminiscent of pre-2017 vibes, Jolley is optimistic about XRP sailing towards higher horizons.
Moreover, Armando Pantoja joins the group chat with a specific prophecy – pegging XRP to rebound to a dignified $1.98. His forecast draws from a noticeable uptick in transaction volume on the XRP network, a beacon highlighting potential future price surges. According to Pantoja, transactional volume spikes often foreshadow price rallies, a trend supported by data from Santiment.
Lastly, adding to the potpourri of opinions, analyst U-copy emphasizes the grand scheme with a long-term perspective. He identifies a seven-year symmetrical triangle formation on the charts. Reflecting on past accumulation periods from 2013 to 2017 and 2018 to 2024, U-copy suggests these calm-before-the-storm phases point towards an imminent, significant breakout.
XRP price levels
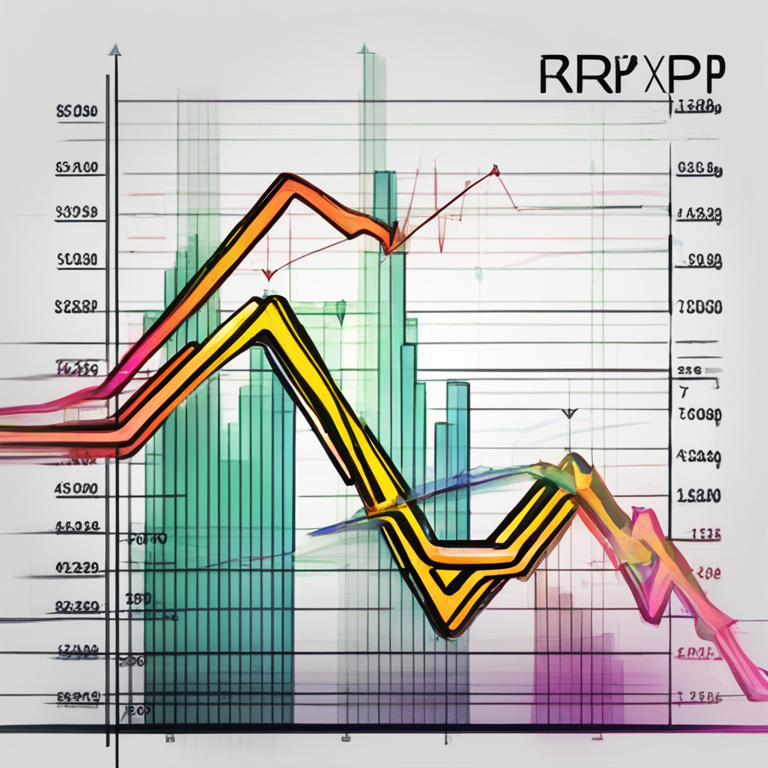
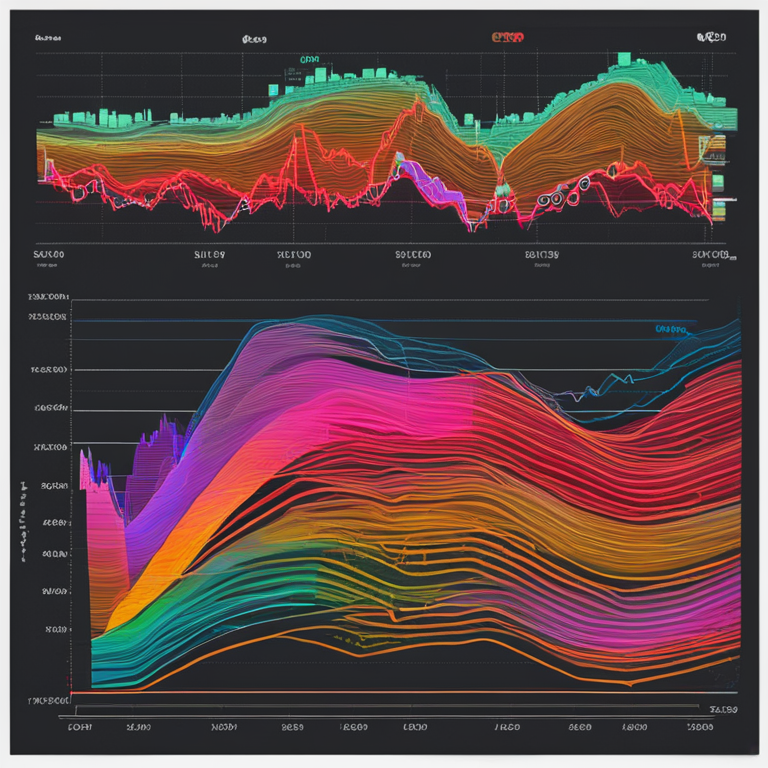
Hold onto your hats, folks, because it looks like XRP might be in for a thrilling ride! According to the sharp-eyed analyst Egrag Crypto, there's something called the "Launching Channel" that has popped up on XRP's charts, and if the stars align, XRP could soar to a jaw-dropping $6.4. That's a 1260% rise from where it’s at now—no, we didn’t add extra zeroes by mistake. But what’s this Launching Channel, you ask? Picture partial wicking candles and ascending consolidation patterns—think of it like a trampoline setup by the universe just waiting for XRP to start bouncing. Egrag emphasizes that keeping this channel intact on a weekly timetable could be our ticket to the moon.
Fibonacci retracement levels
Ah, Fibonacci levels—an analyst's best friend and a trader's guiding light. In Egrag's playbook, there's a treasure map laid out with these levels, helping traders navigate the market currents. The key levels to watch are 0.236 at $0.45193, 0.382 at $0.59865, 0.5 at $0.75138, 0.618 at $0.94306, 0.786 at $1.30324, and last but not least, the 1.272 extension level sitting pretty at $3.32217. It’s like a financial GPS telling you where the buying or selling pressure might ramp up. If these numbers sound like they could unlock a secret safe, that's because they practically do in the trading world.
Historical resistance levels
And what’s a good story without a bit of history? The highest price point caught in the past for XRP, standing solemnly at around $1.96778, is not just a number but a historical resistance level. This point serves as a pivotal mark in XRP’s chronicles, indicating where it has hit walls before. Understanding these resistance levels can give traders insights into how the market might behave when those levels are revisited. Consider these marks as historical landmarks signaling major trends or pivotal shifts in trader sentiment.
Market dynamics
Current XRP trading metrics
So, let's talk present day. XRP is currently lounging at $0.5057, having a lazy Sunday with a minor decline of 0.11% in the past 24 hours. For the week, it's been a bit grumpy, sliding down by 5.82%. But don't let these short-term blues fool you; XRP's still flexing with a market cap of $27.95 billion. That’s some serious muscle. And here's the kicker—the indicators, such as the Accumulation/Distribution line and Bollinger Bands, spill even more secrets about its mood and behavior.
Accumulation/distribution line
Now, for the accumulation/distribution (Accum/Dist) line—a trusty tool for measuring whether traders are hoarding XRP like it's the last slice of pizza at a party or if they’re tossing it away. This line, currently basking at 59.011 billion, goes up when there’s more accumulation than distribution. Translation? More folks are buying than selling, spelling bullish vibes. If this accumulation keeps up, we could see an upward price drift, as traders are basically betting on a better tomorrow for XRP.
Bollinger bands analysis
If you thought Bollinger Bands were a new indie rock band, think again. These bands are all about showing us where the price action is happening. Currently, XRP’s price is hanging a bit below the middle band, lounging in the lower segment of its recent price range. What this suggests is that XRP might be undervalued at the moment—a potential golden window for savvy investors. It’s like being at a designer sale where everything's suddenly affordable but only if the crowd realizes it.
Additional Analysts' Perspectives
When it rains, it pours! And in the world of crypto, that means more expert opinions than you can shake a stick at. Let’s dive into what some of the sharpest minds in the cryptosphere have to say about XRP and its financial future. Spoiler alert: It’s looking pretty upbeat!
Donovan Jolley's perspective
Donovan Jolley, another voice in the choir of crypto enthusiasts, is singing some sweet tunes for XRP. Jolley points out that the alignment of technical indicators with market sentiment hints at a major uptrend. Now, before you raise an eyebrow, let’s break it down. His analyses suggest that old-school altcoins are waking up from their slumber and are poised to ride an all-time high. Jolley uses a fractal—a pattern repeating itself at different scales—to underscore how XRP is mimicking its own behavior from the 2017 bull run. Who knows? We might just see history repeat itself, and if Jolley’s right, this old dog has learned some new tricks. 🚀
Armando Pantoja's price prediction
Next up, we’ve got Armando Pantoja with a price prediction that may have you double-checking your holdings. The man claims that XRP could rebound to $1.98. Now don’t go auctioning off your vinyl collection just yet; let's see his reasoning. Pantoja bases his forecast on a recent spike in transaction volumes on the XRP network. According to Santiment data, there's a strong correlation between transaction volume surges and subsequent price movements. This essentially means more hands are dealing in XRP than trading baseball cards—and we all know what that leads to: possible price rallies!
U-copy's long-term technical analysis
And finally, the pièce de résistance: U-copy’s long-term technical analysis. Imagine a seven-year symmetrical triangle formation—sounds like a geometry class nightmare, right? Well, U-copy assures us it's quite the opposite for XRP. This analyst highlights significant accumulation phases from 2013 to 2017 and again from 2018 to 2024. These phases act as a breeding ground for either major price stabilization or an explosive breakout. According to U-copy, history's got a funny way of paving the path to future profits. So, hang tight, it seems like XRP is gearing up for its next big move!
Conclusion
So, there you have it, folks! We've got Egrag Crypto's bullish launching channel, Donovan Jolley's historical parallels, Armando Pantoja's transaction volume insights, and U-copy's long-term technical analysis. If you're an XRP holder, the horizon is looking brighter than a Black Friday sale at a flashlight store. While these projections are optimistic, remember to dabble responsibly in the crypto jungle. It’s a wild ride, but with these expert analyses, you might just have the map to the treasure! 🏴☠️
Ethan Taylor
Ethan Taylor here, your trusted Financial Analyst at NexTokenNews. With over a decade of experience in the financial markets and a keen focus on cryptocurrency, I'm here to bring clarity to the complex dynamics of crypto investments.


