BREAKING! US PPI Data Announced! What Was the First Reaction of Bitcoin and the Dollar?
- byAdmin
- 14 May, 2024
- 20 Mins

Introduction
Well, folks, strap in! The latest US Producer Price Index (PPI) data has just dropped, and as always, the crypto world has collectively taken a deep breath. With Bitcoin doing its usual roller coaster impression and the Dollar tapping its foot in anticipation, the big question is: how did the markets react? Let's dive right in!
US PPI Data Announcement
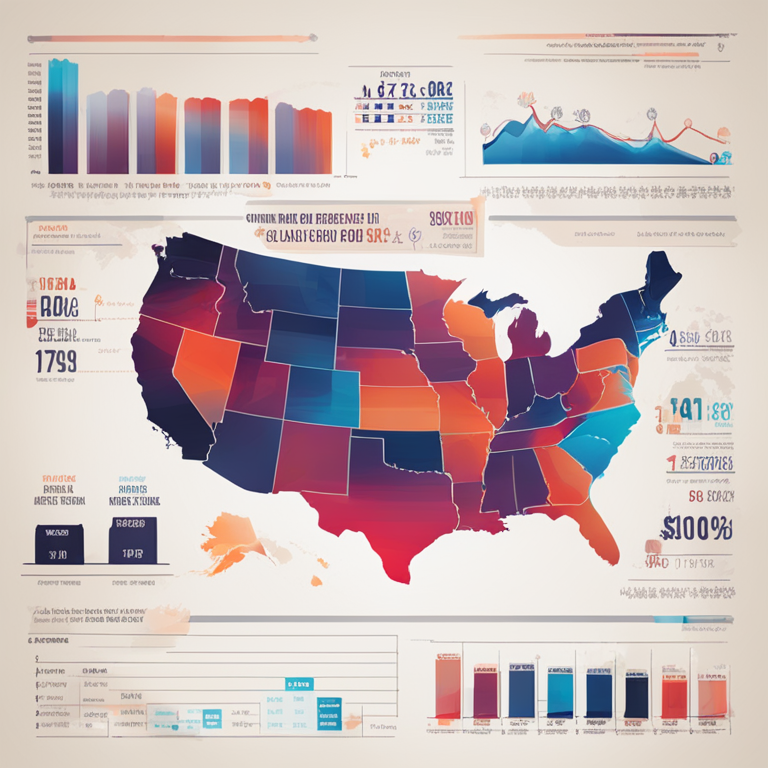
First things first, let's break down this juicy economic nugget we've been handed. The US Producer Price Index (PPI) for the month was revealed with some surprising figures: - **Core Producer Price Index (Monthly):** Announced at 0.5% vs. the expected 0.2% (looks like someone needs to recalibrate their crystal ball!) and the previous 0.2%. - **Core Producer Price Index (Annual):** Sticking to a neat 2.4%, exactly what we anticipated and bang on with last year's data. - **Producer Price Index (Monthly):** Came out at 0.5%, a tad higher than the expected 0.3% and way above the previous 0.2%. Who said volatility was just for the crypto markets? - **Producer Price Index (Annual):** Matching expectations at 2.2%, but sneaking up just a touch from the previous 2.1%.
Now, how did our beloved Bitcoin and the perennial Dollar react to this financial melodrama? Bitcoin, perhaps feeling a bit queasy from its earlier highs, didn't take too kindly to the news. After flirting with the $63,000 mark earlier in the week, it suddenly remembered it had a pressing engagement back at $61,000, dragging its value down with significant flair.
The Dollar Index (DXY) on the other hand, was equally dramatic. Having waited with bated breath for the data, its initial reaction was a mixed bag, with oscillations that would make even the calmest trader a bit dizzy. As per usual, these economic data drops rarely come without repercussion, rippling through both fiat and crypto markets with the subtlety of a caffeinated squirrel.
So, there you have it! It's always a whirlwind when these announcements hit, and today was no different. Until the next data drop sends us into another frenzied analysis, hold onto your hats, folks, and keep those charts handy!

Details of the PPI Data
Ready for a rollercoaster ride through the world of economics? Hold on to your hats, because the U.S. Producer Price Index (PPI) data has just dropped, and it’s got the financial markets buzzing! For the uninitiated, PPI measures the average change over time in the selling prices received by domestic producers for their output. In simple terms, it’s like a thermometer for the health of the economy, but instead of checking for fevers, it checks for price changes. Anyway, without further ado, let's dive into the nitty-gritty!
Core Producer Price Index (Monthly)
First on our economic tour is the Core Producer Price Index (Monthly). The core PPI is basically the PPI’s cooler, more focused sibling – it excludes the volatile food and energy prices to give a clearer picture of underlying trends. For this month, the data revealed a 0.5% increase. Now, if you’re thinking that’s a bit of a surprise, you’re not alone. Analysts expected a more modest rise of just 0.2%, in line with last month’s figure. So, it's like expecting a drizzle and getting a downpour! This unexpected jump could signal stronger underlying inflationary trends. Buckle up, it’s going to be an interesting ride!
Core Producer Price Index (Annual)
Next, we have the Core Producer Price Index (Annual). This data point is essentially the marathon runner in the PPI family, showing how prices change year-over-year. For this period, the index remained steady at 2.4%, exactly matching both the previous year’s data and the analysts' forecasts. It’s as if the economy decided to stay on cruise control, which, in these unpredictable times, could either be seen as a good thing or a missed opportunity for some excitement. Bottom line: stability can be both a blessing and a bore!
Producer Price Index (Monthly)
Moving on, we have the headline act – the Producer Price Index (Monthly). This index covers the whole shebang, including those pesky food and energy prices. This month, the PPI showcased a 0.5% increase, slightly above the expected 0.3% and last month’s 0.2%. It’s like when you go to a restaurant expecting a small bill and end up paying a bit more because you couldn’t resist dessert. This rise might suggest that inflationary pressures are still lurking, ready to pounce when least expected. Is it a sign of good times or impending challenges? Only time will tell.
Producer Price Index (Annual)
Finally, we have the granddaddy of them all – the Producer Price Index (Annual). Over the past year, the PPI has risen by 2.2%, holding steady with analysts' expectations and slightly up from the previous 2.1%. It’s like running a long-distance race and maintaining a consistent pace – no sudden bursts, no slowing down. This consistent rise reflects a stable, yet persistent upward trend in prices, giving the markets a sense of stability in an otherwise turbulent sea of economic indicators.
Market Reactions
Now, let’s see how the markets are reacting to all this number crunching. Spoiler alert: it's been a bit of a mixed bag, like a box of assorted chocolates where you’re unsure whether you’ll get a delightful caramel or an unexpected licorice!
Bitcoin Reaction
First up, Bitcoin. Our favorite digital asset started the week on a high, cruising above $63,000, probably feeling all bullish and invincible. But it seems Bitcoin couldn't handle the heat of the new PPI data as it saw a drop back to the $61,000 levels. It’s as if Bitcoin had a little too much espresso – weeks began high on energy but eventually fizzled out. This reaction could be due to concerns about rising inflation, which might lead to tighter monetary policies. Bottom line: Bitcoin’s trip through the PPI data has been more “Wheee!” and less “steady as she goes.”
Dollar Reaction
Next in line, the Dollar Index (DXY). Unlike Bitcoin, the dollar seemed to have a more measured response to the PPI data. It didn’t throw a tantrum or start doing jumping jacks; instead, it maintained a relatively composed demeanor. The stability in the annual PPI figures could be a reason for this measured response, giving investors a sense of assurance. In the grand scheme of things, it’s like the dollar was expecting a storm but only got a drizzle – enough to acknowledge but not enough to change into galoshes.
So, there you have it, folks! The latest PPI data has stirred the pot in the financial markets, sending Bitcoin on a wild ride and leaving the dollar somewhat unfazed. Buckle in, because the economic landscape is as dynamic as ever, and who knows what twists and turns await us next!
Breaking! US PPI Data Announced! What was the first reaction of Bitcoin and the dollar?
The crypto world and the traditional financial markets have a love-hate relationship, and nothing showcases this better than the rollercoaster reactions to economic data. Today, we saw the release of the US Producer Price Index (PPI), and you could practically hear the keyboards smashing worldwide as investors scrambled to respond. One eye on the report, the other on the price of Bitcoin, and, well, both were blinking wildly.
Bitcoin gave us a masterclass in volatility, in case anyone needed reminding. The digital gold started strong this week, charging past the $63,000 mark like it was on a caffeine rush. But just as suddenly, it backpedaled to hover around $61,000, giving investors a mild case of whiplash. This wasn't just another day in crypto land; it was a day fueled by anticipation for the PPI data, a key economic indicator.
The PPI data revealed today painted an interesting picture: The Core Producer Price Index (monthly) was announced at 0.5%, higher than the anticipated 0.2% and the previous 0.2%. On an annual basis, the Core PPI stuck to expectations at 2.4%. The overall PPI numbers also threw some curveballs, with the monthly figure hitting 0.5%, above the expected 0.3% and the previous 0.2%. Annually, the PPI stayed on point at 2.2%, as expected, but nudged up from the previous 2.1%. And just like that, the financial markets had all the ammo they needed for wild speculations.
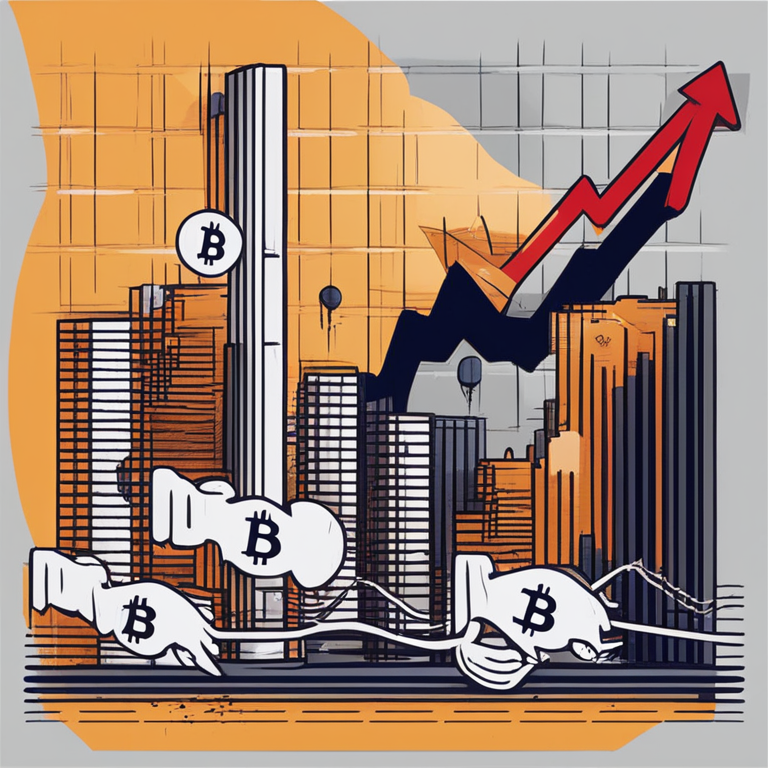
The first reactions were as dramatic as you’d expect. Bitcoin, the rebellious teenager of the finance world, immediately took a dive. Investors, ever fickle, reacted to the data by selling off BTC, which saw it plunge again to around $61,000. Meanwhile, the traditional good ol' greenback, represented by the Dollar Index (DXY), did its usual counter-move. When the world is freaking out about inflation signals, the dollar gets a little bit of a confidence boost. So, while Bitcoin was having a bit of an existential crisis, the dollar stood a little taller, even if just momentarily.
It's funny how economic data can be like the weather – always changing and often surprising. Today's PPI data wasn't shocking, but it was enough to stir the pot. Investors will continue to analyze these numbers like cryptic horoscopes, trying to predict the next move in both the crypto and traditional markets. If there's one takeaway, it's this: Always expect the unexpected, especially when Bitcoin and economic indicators are in the same sentence. So, grab your popcorn, because the show is far from over.
Ethan Taylor
Ethan Taylor here, your trusted Financial Analyst at NexTokenNews. With over a decade of experience in the financial markets and a keen focus on cryptocurrency, I'm here to bring clarity to the complex dynamics of crypto investments.


